Australia Solar Report

Discover comprehensive insights into the statistics, market trends, and growth potential surrounding the solar panel manufacturing industry in Australia

  1. Climate Top. (2024). Sunshine & Daylight Hours in Sydney, New South Wales, Australia. Retrieved from https://www.climate.top/australia/sydney/sunlight/
  2. Kom5grad. (2024). How Much Power Will My Solar Panel Output in Sydney? Retrieved from https://1komma5grad.com/au/blog/much-power-will-solar-system-generate-sydney
  3. ECOFLOW. (2024). Average Electricity Prices in Australia per kWh. Retrieved from https://blog.ecoflow.com/au/average-electricity-prices-in-australia-per-kwh/#:~:text=A%20single%20kWh%20of%20electricity,how%20much%20power%20you%20use.
  4. Climate Council. (2024). Your guide to electricity. Retrieved from https://www.climatecouncil.org.au/wp-content/uploads/2019/03/Factsheet-Electricity-Reliability.pdf
  5. Australian PV Institute. (2024). Australian PV market since April 2001. Retrieved from https://pv-map.apvi.org.au/analyses#:~:text=As%20of%2031%20March%202024,capacity%20of%20over%2035.6%20gigawatts.
  6. L. Granwal. (2024). Projected installed large-scale solar power generation capacity Australia 2020-2035. Retrieved from https://www.statista.com/statistics/1098771/australia-large-scale-solar-generation-capacity-projection/
  7. Wikipedia. (n.d.). Cost of electricity by source. Retrieved July 11, 2024, from https://en.wikipedia.org/wiki/Cost_of_electricity_by_source
  8. Australian Government. (2023). Australian electricity generation – fuel mix. Retrieved from https://www.energy.gov.au/energy-data/australian-energy-statistics/data-charts/australian-electricity-generation-fuel-mix
  9. Green Review. (2024). Near record year for residential solar power installations. Retrieved from https://greenreview.com.au/energy/near-record-year-for-residential-solar-power-installations/
  10. Australian Energy Council. (2022, January). Solar Report. Retrieved from https://www.energycouncil.com.au/media/5wkkaxts/australian-energy-council-solar-report_-jan-2022.pdf
  11. Codde Chessher. (2024). 11 Solar Energy Statistics in Australia (2024 update). Retrieved from https://housegrail.com/solar-energy-statistics-australia/
  12. ARENA. (2024). Off grid. Retrieved from https://arena.gov.au/renewable-energy/off-grid/
  13. Daniel Merce. (2024). ‘Staggering’ rise of rooftop solar to put all other power generation in the shade, report finds. Retrieved from https://www.abc.net.au/news/2024-02-21/rooftop-solar-cells-in-australia-to-outperform-demand/103489806
  14. Anna Hendrsen. (2024). Renewables could power most of Australia by 2040, Australian Energy Market Operator plan shows. Retrieved from https://www.abc.net.au/news/2020-07-30/australian-energy-market-operator-report-renewables-power/12507384
  15. Growatt. (2024). Australia: Solar News, Trends, and Forecasts for 2024. Retrieved from https://au.growatt.com/media/news/australia:-solar-news,-trends,-and-forecasts-for-2024
  16. Jooble. (n.d.). Solar installer salaries. Retrieved from https://au.jooble.org/salary/solar-installer
  17. Worldometer. (2024). Australia population 2024. Retrieved from https://www.worldometers.info/world-population/australia-population/
  18. Statista. (2021). Average net face rent of industrial property in Australia in second quarter 2021, by location (in Australian dollars per square meter). Retrieved from https://www.statista.com/statistics/1239493/australia-average-net-face-rent-of-industrial-property-by-location/
  19. Global Petrol Prices. (2024). Australia electricity prices. Retrieved from https://www.globalpetrolprices.com/Australia/electricity_prices/
  20. Australian Bureau of Statistics. (2023). Water Account, Australia. Retrieved from https://www.abs.gov.au/statistics/environment/environmental-management/water-account-australia/latest-release
  21. Calauti, L. (2019). How much does it cost to rent office space? Commercial Real Estate. Retrieved from https://www.commercialrealestate.com.au/advice/how-much-does-it-cost-to-rent-office-space-57245/
  22. International Energy Agency (IEA). (2021). National Survey Report of PV_Australia Power Applications in Country. Retrieved from https://iea-pvps.org/wp-content/uploads/2022/08/PViA-Report-2022-AUS_v3.pdf
  23. Clean Energy Council. (2022). Clean Energy Australia Report 2022. Retrieved from https://assets.cleanenergycouncil.org.au/documents/resources/reports/clean-energy-australia/clean-energy-australia-report-2022.pdf
  24. Wikipedia. (n.d.). Electricity sector in Australia. Retrieved July 11, 2024, from https://en.wikipedia.org/wiki/Electricity_sector_in_Australia#:~:text=Due%20to%20its%20large%20size,submarine%20DC%20cable%20with%20Tasmania

Key points

  • All figures have been converted into USD

Yearly sunshine (sun hours per year)

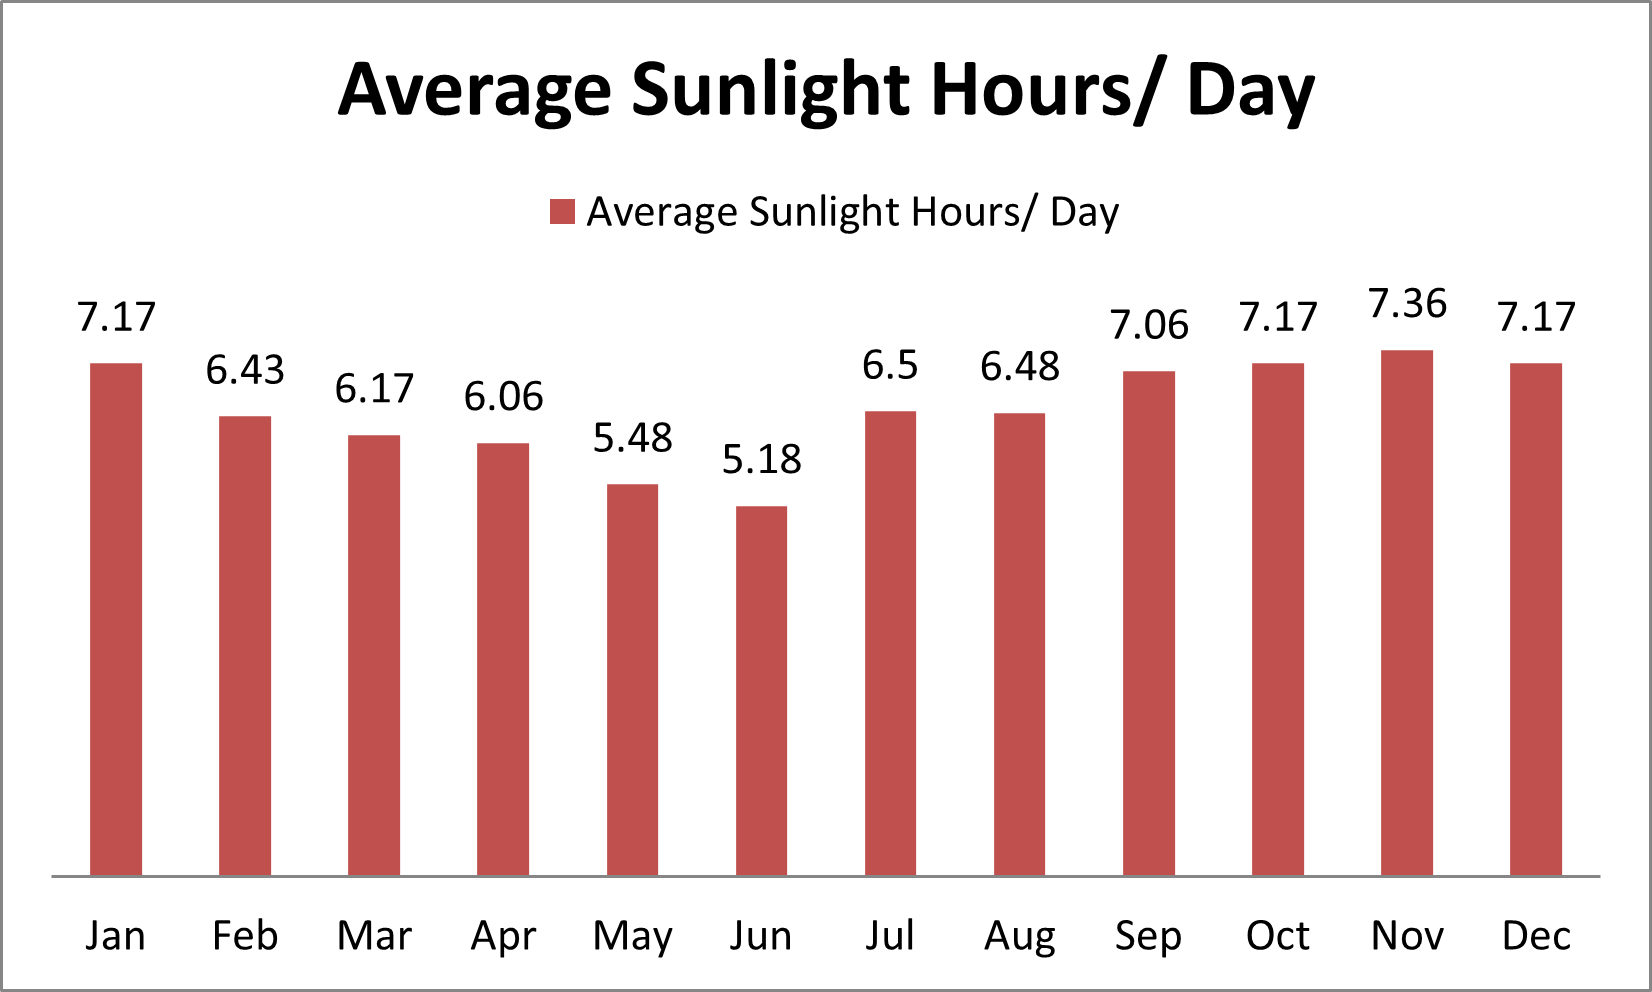
There is an average of 2426 hours of sunlight per year (of a possible 4383) with an average of 6 hours 38 minutes of sunlight per day.1

Read more

Figure 01 Average Sunlight hours/day in Australia

kWh per kWp installed

In terms of electricity output per kilowatt (kW) of installed solar, you can expect 1424kWh/kWp/yr.2

Read more


Average cost per kWh from utility company

The cost of electricity consumption is commonly referred to as a “usage charge,” which is quantified in kilowatt-hours (kWh). In Australia, electricity providers typically charge a rate ranging from 20 to 35 cents per kWh, although these rates can fluctuate depending on the specific state or region.3

Read more


Reliability of electrical power supply grid

  • Australia’s electricity system has demonstrated improved reliability over the past decade.
  • A recent Parliamentary Inquiry revealed notable enhancements in power supply consistency, stating that customers who previously experienced an average of two interruptions annually now encounter only one interruption per year, excluding instances resulting from floods and cyclones.
  • Furthermore, a significant majority (97%) of power supply interruptions are attributable to events impacting power lines, including both distribution and transmission lines.4

Read more


Detailed Information

  • All figures have been converted into USD
  • Total solar panel production capacity (installed)

    As of 31 March 2024, Australia is currently producing over 34 gigawatts (GW) of electricity from solar.5

    Total solar panel production capacity (projected)

    6

    • By 2030, the country is projected to reach 66 GW of installed solar capacity.
    • By 2050, the projections can reach up to 98.5 GW.
    • An annual growth rate of 13.74% is expected (CAGR 2024-2029).

    Average costs of various electricity generation sources (coal, natural gas, solar, etc)

    A comparative analysis of electricity generation costs reveals the following average costs per megawatt-hour (MWh) in Australian dollars:7

    • Solar power: AUD 69.56/MWh, representing the lowest average cost
    • Onshore wind energy: AUD 85.84/MWh, a competitive renewable energy source
    • Combined cycle gas plants (Gas CC): AUD 119.88/MWh
    • Wind energy with storage: AUD 128.76/MWh
    • Solar power with storage: AUD 174.64/MWh
    • Standalone 4-hour energy storage systems: AUD 230.88/MWh
    • Gas peaker plants: AUD 337.44/MWh, the highest average cost, primarily used to meet peak demand

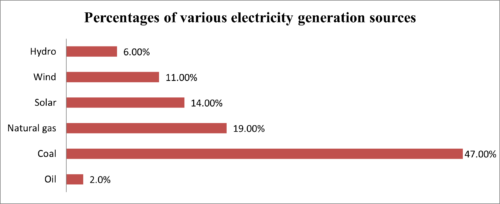
    Percentages of various electricity generation sources (coal, natural gas, solar, etc)

    Distribution of electricity generation in Australia is given below 8

    Figure 02: Percentages of various electricity generation sources for year 2022-2023

    Average daily availability of electricity from the national grid (measured in hours)

    In Australia, the average daily availability of electricity from the national grid is approximately 24 hours, reflecting a high reliability of Australia solar energy integration.

    Number of residential solar panel installations

    Current Installations 9

    • With more than 3.7 million solar power systems installed, Australia remains the world’s leading country for per-capita uptake of rooftop solar power.
    • There are more than three solar panels installed for every Australian.

    Projected Installations 10

    • Projections indicate that the actual number of new rooftop solar installations will surpass current reports, with an anticipated total of approximately 386,798 small-scale solar photovoltaic (PV) systems.
    • This would represent a total installed capacity of around 3,218 megawatts (MW). As more data becomes available, the final number of new installations is expected to increase, reflecting a robust growth in rooftop solar adoption.

    Total number of solar farms (installed and projected)

    11

    Installed Solar Farms

    Australia has approximately 564 operational solar farms.

    Projected Solar Farms

    • Although an exact count of solar farms is difficult to determine due to the dynamic nature of ongoing projects, large-scale solar energy generated an impressive 11 million megawatt hours (MWh) in 2022.
    • Estimates suggest that there are approximately 2,300 solar farms in various stages of planning and development, underscoring the rapid growth and expansion of the solar industry.
    • This number is expected to continue evolving as new projects come online and existing ones are completed.

    Off-grid market demand for solar panels (current and projected)

    12

    Current Demand

    Exact number is not available but:

    • Only two per cent of Australia’s population live in off grid locations, however more than six per cent of Australia’s electricity use occurs in these regional and remote areas.

    Projected Demand

    • Off grid demand will increase in future.
    • Resorting to off-grid power sources is increasing in the mining sector due to several remote mining sites.

    On-grid market demand for solar panels (current and projected)

    131415

    Current Demand

    Residential Sector:

    • High Penetration: Over 30% of Australian homes have rooftop solar panels.
    • Annual Installations: Approximately 3 GW of rooftop solar capacity added annually.
    • Drivers: Rising electricity prices, declining costs of solar panels, and government incentives.

    Commercial and Industrial Sector:

    • Growing Adoption: Businesses are increasingly installing solar panels to reduce operating costs.
    • Annual Installations: Around 1 GW added annually in this sector.
    • Drivers: Corporate sustainability goals, economic benefits, and government support.

    Utility-Scale Projects:

    • Significant Growth: Large-scale solar farms are rapidly being developed.
    • Annual Installations: Roughly 2-3 GW of utility-scale solar capacity added annually.
    • Drivers: Renewable energy targets, competitive auctions, and decreasing costs of solar technology.

    Projected Demand (2025-2030)

    Residential Sector:

    • Continued Growth: Expected to grow by 10-15% annually, driven by technological advancements and increasing environmental awareness.
    • Cumulative Capacity: Projected to reach around 25 GW by 2030.
    • Innovations: Growth in smart home systems and energy storage integration.

    Commercial and Industrial Sector:

    • Expanding Market: Projected to grow by 12-20% annually.
    • Cumulative Capacity: Expected to reach around 10 GW by 2030.
    • Emerging Trends: Increased use of solar panels in combination with battery storage and energy management systems.

    Utility-Scale Projects:

    • Accelerated Development: Anticipated to grow by 15-25% annually.
    • Cumulative Capacity: Projected to reach around 40 GW by 2030.
    • Major Drivers: National Renewable Energy Target (RET), state-level policies, and international commitments to reduce carbon emissions.

    Average monthly income of workers in solar industry (labor cost)

    Solar installer salary statistics in Australia as of 3 July 2024, the represented employee makes approximately AUD $167,000 per year, with a precise pay rate of AUD $13,800 per month, AUD $3,167 per week, or AUD $86.77 per hour.16

    Population of the country

    The current population of Australia is 26,703,181.17

    Average overhead costs of solar panel production (with a brief breakdown)

    Estimate for Factory Rent 18

    Average Warehouse Rental Cost

    As of the second quarter of 2021, the average net face rent for industrial property in Australia varies by location. Here are some figures:

    • South Sydney: The most expensive net face rent was approximately AUD 211.53 per square meter.
    • Central West Sydney: The second highest net face rent was approximately AUD 162.02 per square meter.

    Also, Warehouse rents have risen by an average of 16% since the start of 2022 and are expected to rise by 25% by 2026.

    Business Electricity Price (December 2023) 19

    • In Australia, the electricity price for businesses is approximately AUD 0.28 per kWh.
    • This includes power, distribution, and taxes.

    Average Water Prices (2021-22) 20

    Industry paid an average of AUD 0.31 per kilolitre, reflecting a decrease of 0.8% from 2020-21.

     Key Components of Administrative Costs

    Salaries and Wages: 16

    Solar installer salary statistics in Australia as of 3 July 2024, the represented employee makes approximately AUD $167,000 per year, with a precise pay rate of AUD $13,800 per month, AUD $3,167 per week, or AUD $86.77 per hour.

    Rent for Office Space 21

    If the administrative office is separate from the factory, rental costs for the office space;

    • Commercial lease rates per square meter in Sydney’s CBD are the highest in Australia, with prime-grade (premium and A-grade) offices at net rental levels of an average of 1,468.16 AUD per square meter per annum.
    • Following table outlines the net face rent per square meter and the incentives offered in different areas across New South Wales (NSW), Victoria (Vic), and Queensland (Qld) in Australia.
    State Area Net Face Rent (AUD/sqm)
    NSW Sydney CBD premium 1,025
    North Sydney 785
    Parramatta 485
    CBD fringe 675
    Vic Melbourne CBD premium 698
    St Kilda Rd 400
    Southbank 495
    City Fringe 460
    Qld Brisbane CBD premium 670
    Inner south 458
    Gold Coast 380

    A summary of the energy infrastructure

    24

    Electricity Generation

    • Australia generates electricity through a diverse mix of energy sources.
    • The primary sources include coal-fired thermal power plants, natural gas, renewable energy sources such as wind and solar power, and hydropower.
    • The electricity sector in Australia has been historically dominated by coal-fired power stations, but renewables are forming a rapidly growing fraction of supply.
    • In 2021, Australia’s electricity production reached 265 TWh, with coal accounting for 52.9% and natural gas for 18.8%.
    • Renewable sources, comprising solar, wind, hydro, and bioenergy with waste, collectively made up 26.7% of the total electricity generation mix Australia has abundant solar resources, making it well-suited for large-scale solar energy projects.

    Transmission & Distribution

    • Australia’s electricity transmission infrastructure is a vast and complex network that spans the country, connecting densely populated urban centers and remote areas through a national grid system.
    • The transmission network operates at multiple voltage levels, with primary transmission lines functioning at 330 kilovolts (kV) and 500 kV, ensuring a reliable and efficient distribution of electricity across the nation.
    • Due to Australia’s expansive size and population distribution, a single, unified grid encompassing all states is not feasible. Instead, the country’s transmission grid is comprised of a primary east-coast network extending from Queensland, through New South Wales and Victoria, to South Australia, as well as a submarine DC cable connection to Tasmania, facilitating a comprehensive and interconnected electricity transmission system.

    Energy Access

    • Australia has a high rate of electricity access, with nearly 100% of the population having access to reliable electricity.
    • The country’s energy access efforts are concentrated on maintaining and expanding infrastructure to meet increasing electricity demand, particularly in regional and remote areas.

    Energy Exports

    • Australia is a significant exporter of energy resources, including coal and natural gas.
    • While electricity exports are not as prominent as other energy commodities, Australia has potential for regional electricity trade.

    Some of the government regulations surrounding solar panel production

    Australia has implemented several regulations to promote and manage the deployment of solar panels. Here are some key regulations:22

    Renewable Energy Target (RET) Regulations:

    • Large-scale Renewable Energy Target (LRET): This regulation requires large-scale renewable energy projects, including solar farms, to create Large-scale Generation Certificates (LGCs) for each megawatt-hour of power they generate. These certificates are then sold to electricity retailers to meet their obligations under the RET.
    • Small-scale Renewable Energy Scheme (SRES): Under this scheme, small-scale solar PV systems can generate Small-scale Technology Certificates (STCs) based on the amount of electricity they produce. These certificates can be traded to offset installation costs. The scheme is regulated by the Clean Energy Regulator (CER) and runs until 2030.

    Clean Energy Council (CEC) Accreditation:

    • Installers and designers of solar PV systems must be accredited by the CEC. This accreditation ensures that the systems are installed correctly and safely. The CEC sets the standards for installation practices, which include specific training and adherence to safety guidelines.

    Australian Standards for Solar PV Systems:

    • AS/NZS 5033:2014: This standard specifies installation and safety requirements for photovoltaic (PV) arrays. It includes guidelines for system design, installation, and maintenance.
    • AS/NZS 4777.1:2016 and AS/NZS 4777.2:2015: These standards cover the grid connection of energy systems via inverters. They include requirements for the performance and testing of inverters connected to the grid.

    Grid Connection Requirements:

    • Solar PV systems must meet the technical standards set by local electricity network providers for grid connection.
    • This includes compliance with voltage and frequency stability requirements, anti-islanding protection, and the ability to communicate with grid operators for demand response and other grid management activities.

    National Construction Code (NCC) Compliance:

    • Solar installations must comply with the National Construction Code, which sets out the construction requirements for buildings in Australia.
    • This includes ensuring that rooftop solar installations do not compromise the structural integrity of buildings.

    Electrical Safety Standards:

    • Installations must comply with the Australian Electrical Standards (AS/NZS 3000:2018, also known as the Wiring Rules), which specify the safety requirements for electrical installations, including solar PV systems.

    Battery Storage Regulations:

    • Standards such as AS/NZS 5139:2019 cover the installation of battery energy storage systems connected to solar PV systems. This standard ensures that battery systems are installed safely and are compatible with the existing electrical infrastructure.

    Government initiatives in solar panel production (includes investments and subsidies)

    Government initiatives in solar panel production in Australia involve various policies and programs providing investments and subsidies to support renewable energy, specifically solar power. Key initiatives include:22

    Renewable Energy Target (RET):

    • This scheme allows both large-scale power stations and small-scale systems to generate certificates for the power they produce, which are then bought by electricity retailers to meet legal obligations, creating financial incentives.

    Small-scale Renewable Energy Scheme (SRES):

    • Supports small solar PV systems and other renewable technologies by issuing Small-scale Technology Certificates (STCs) that reduce the upfront cost of installations, leading to increased adoption and larger system sizes over time.

    Large-scale Renewable Energy Target (LRET):

    • Provides targets for large-scale renewable energy projects, such as solar farms, which generate Large-scale Generation Certificates (LGCs) to incentivize production.

    State-Based Direct Subsidies

    • New South Wales (NSW): Offers up to 3,000 free 3 kW solar installations for low-income households.
    • Australian Capital Territory (ACT): Provides a 1675 USD incentive for low-income households to install rooftop solar panels.
    • Victoria:
      • Solar Homes Program: Offers eligible households a rebate of up to 50% of the purchase cost for solar PV systems, up to 1239.50 USD.
      • Small Business Rebate: Provides a rebate of 50%, up to 2345 USD, for installing solar PV systems on businesses, along with access to interest-free loans.

    Notable solar projects in the country (installed and projected)

    23

    Installed Projects

    Darlington Point Solar Farm

    • Location: Darlington Point, New South Wales
    • Capacity: 275 MW
    • Details: Owned by Edify and Fern Trading, commissioned in 2021.

    Kiamal Solar Farm

    • Location: Kiamal, Victoria
    • Capacity: 200 MW
    • Details: Owned by Total Eren, commissioned in 2021.

    Wellington Solar Farm

    • Location: Wellington, New South Wales
    • Capacity: 174 MW
    • Details: Owned by Lightsource BP, commissioned in 2021.

    Coleambally Solar Farm

    • Location: Coleambally, New South Wales
    • Capacity: 150 MW
    • Details: Owned by Neoen, commissioned in 2018.

    Daydream Solar Farm

    • Location: Daydream, Queensland
    • Capacity: 150 MW
    • Details: Owned by Edify Energy, commissioned in 2019.

     Projected Projects

    Solar River Project

    • Capacity: 200 MW (Phase 1), expandable to 400 MW
    • Location: South Australia
    • Details: Planned to be one of the largest in the country, including a significant battery storage component to enhance grid stability.

    Sun Cable’s Australia-Asia Power Link (AAPowerLink)

    • Capacity: 10 GW
    • Location: Northern Territory
    • Details: An ambitious project aiming to supply solar power from Australia to Singapore via a submarine cable. It will include the world’s largest solar farm and battery storage system.

    Western Downs Green Power Hub

    • Capacity: 460 MW
    • Location: Western Downs, Queensland
    • Details: Set to be the largest solar farm in Australia once completed, supplying power to the national grid and contributing significantly to the state’s renewable energy targets.

    New England Solar Farm

    • Capacity: 720 MW (with 400 MWh battery storage)
    • Location: New England, New South Wales
    • Details: Designed to be a major renewable energy hub, integrating both solar generation and battery storage.

    Some of the notable solar companies (plus brief details on what they do)

    SunBoost

    Website: https://www.sunboost.com.au/

    Services:

    • SunBoost is Australia’s largest solar company, offering a 30-day money-back guarantee on their products.
    • They provide solar panels and inverters approved by the Clean Energy Council, ensuring compliance with Australian standards.

    NSEG (National Solar Energy Group)

    Website: https://www.nationalsolarenergy.com.au/

    Services:

    • NSEG started in 2009 and has expanded operations across most Australian states.
    • They are a leading rooftop solar installer by volume and employ over 350 staff.
    • NSEG focuses on ensuring a sustainable energy future and helping customers benefit from renewable energy transitions.

    GEM Energy

    Website: https://gemenergy.com.au/

    Services:

    • Established in 2013, GEM Energy offers integrated turn-key solar energy solutions across Australia.
    • They have quickly become a multi-award-winning renewable energy provider, aiming to make renewable energy accessible to every Australian family.

    Tindo Solar

    Website: https://tindosolar.com.au/

    Services:

    • Tindo Solar is committed to sustainability and manufactures premium solar panels designed for Australian conditions.
    • Their products are produced in Adelaide and known for their excellent quality and long lifetime achievement.
    • Tindo Solar offers a 25-year performance guarantee on their products, providing added peace of mind to homeowners investing in solar energy.
    • Their focus is on minimal resource usage and maximizing energy efficiency for their customers across Australia.

    Arise Solar

    Website: https://gemenergy.com.au/

    Services:

    • Arise Solar is dedicated to providing clean energy solutions to homes and businesses across Australia.
    • They focus on offering international quality standard solar energy systems, aiming to contribute to a cleaner future while helping customers save on energy bills.

Free Solar Energy Course:

Your First Step In Solar Production

In 2021, the global market size of solar power was valued at 167.83 billion USD, and it is projected to grow from 234.86 billion USD in 2022 to 373.84 billion USD by 2029, exhibiting a CAGR of 6.9% during the forecast period.

Our Services

Business Plan E-Course 

Learn more about our free e-Course here

Full Scale Solar Production Service

Learn more about our full scale production service here

Consulting Service

Learn more about our free consulting service here

Turnkey Service

Learn more about our free turnkey service here

Are you interested in starting your own solar module production line?

We can help you start your own solar module production company. With our 100% turnkey service, we will deliver the needed machines, do a technology transfer, provide expert and excellent support, and help you with the know-how needed to start even if you don't have any previous experience in this industry.

Start Your Own Solar Panel Production Line Today!

>